Snake speed test
In this tutorial, we will take a look at some of the best practices about why and how to A/B test mobile application. Whether you are a new developer looking to build your first real app, or an experienced mobile developer, this tutorial will help you understand how Vessel can be used in A/B testing your production mobile app.
Problem
Greg is the product manager at gaming company, which develops mobile games for all major platforms like iOS, Android, Windows 8. Greg’s team is planning to launch entirely new user interface for their mobile game called as “Snakes”.
Snake is a single player mobile game. Aim is to eat all apples in your screen and grow bigger without hitting wall or any part your tail. But Greg finding it difficult to figure out
- What should be the correct speed of Snake ?
- How many apples I should show on the screen ?
- Snake color Red works better or Green works betters ?
- What should be the greeting message ?
These factors are critical for success of the application. One incorrect decision might result in lost opportunity and waste of time . How to solve this problem ?
Solution: A/B Test Snake Speed.
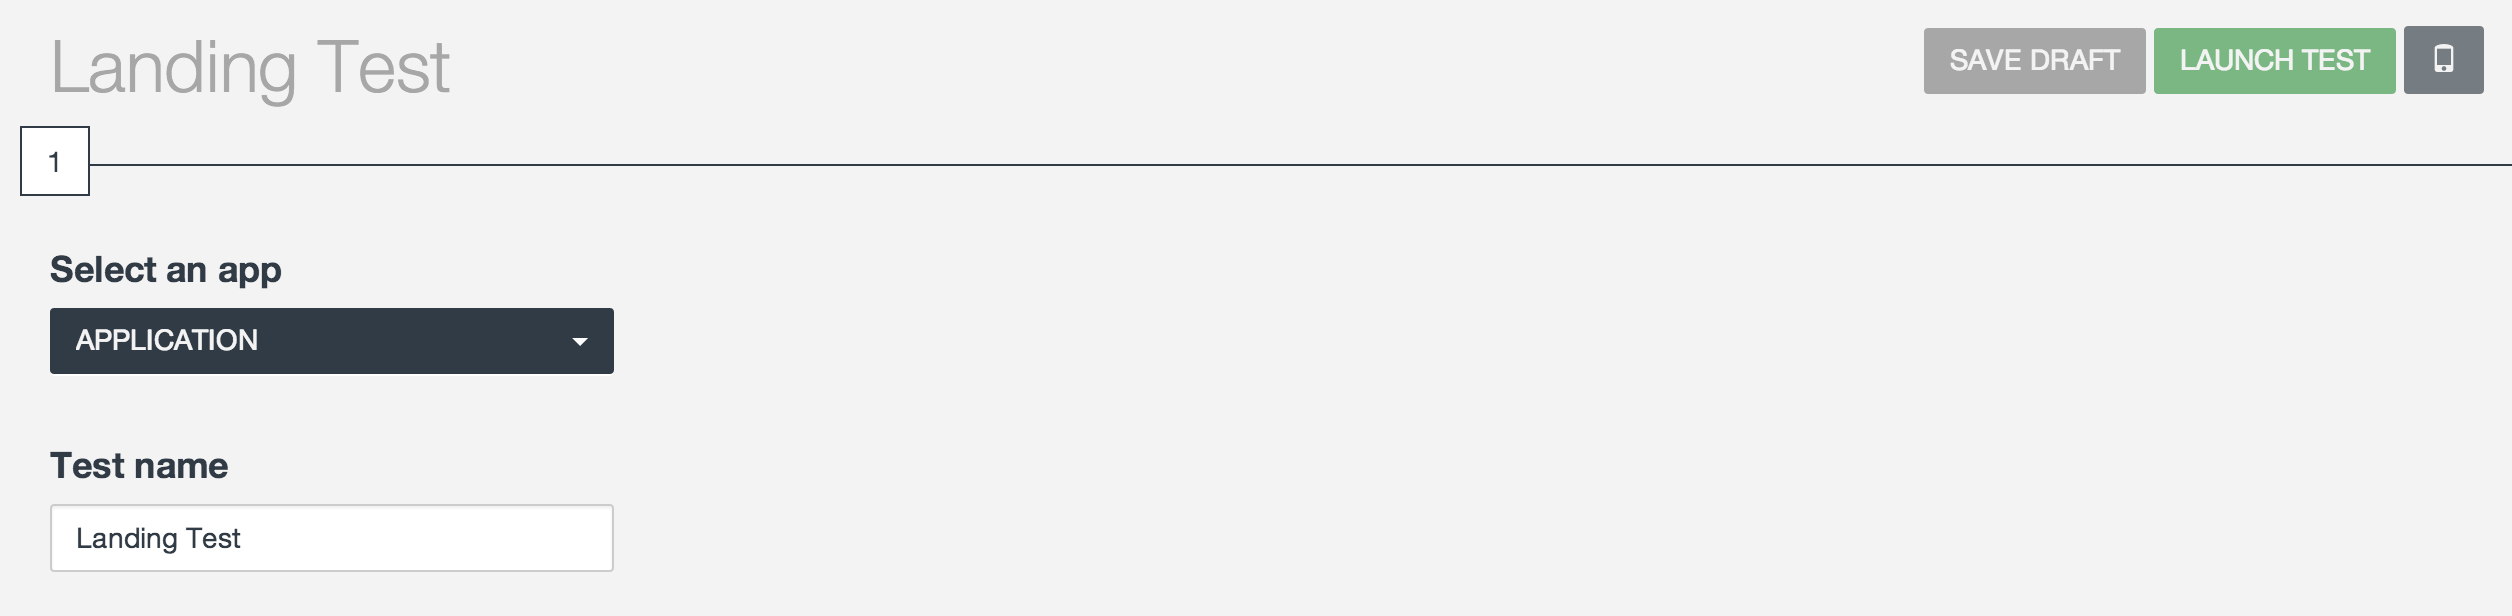
- Greg registers to the Vessel Platform and creates a basic experiment named as "BaisicTest".
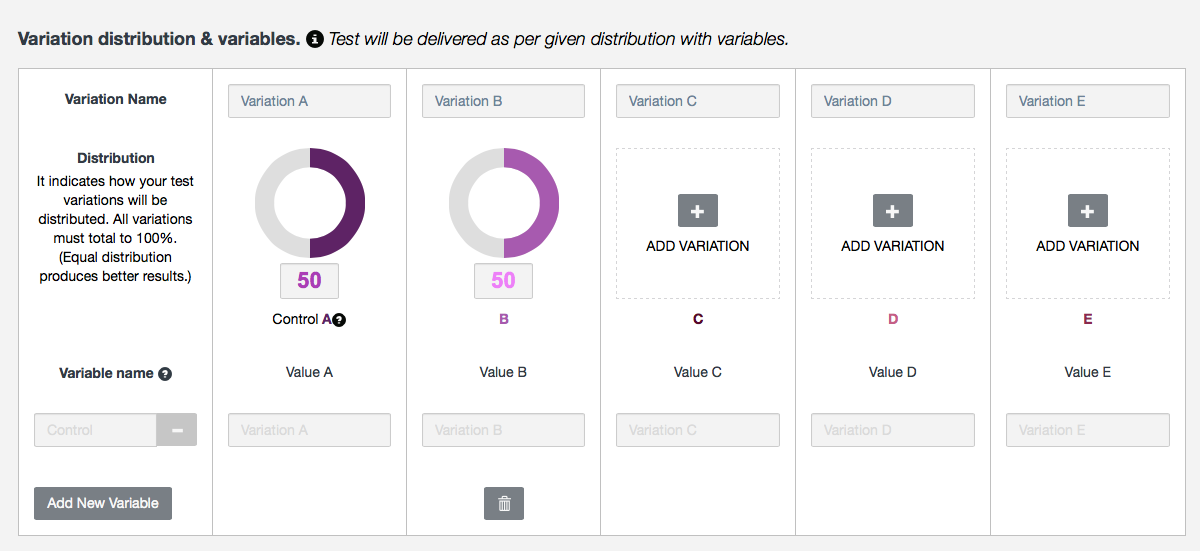
- After creating the experiment, He adds two variations A and B giving 50% and 50% distribution weight. Goal of this experiment is to monitor usage time and monitor the number of users reaching level two. Greg also interested in monitoring a funnel to achieve this goal.
- After defining experiment in Vessel, Greg downloads VesselSDK for the instrumentation in his app. Instrumentation is extremely simple as shown bellow (For further instrumentation & advanced details like session time monitoring, checkpoints please refer VesselSDK technical documentation.)
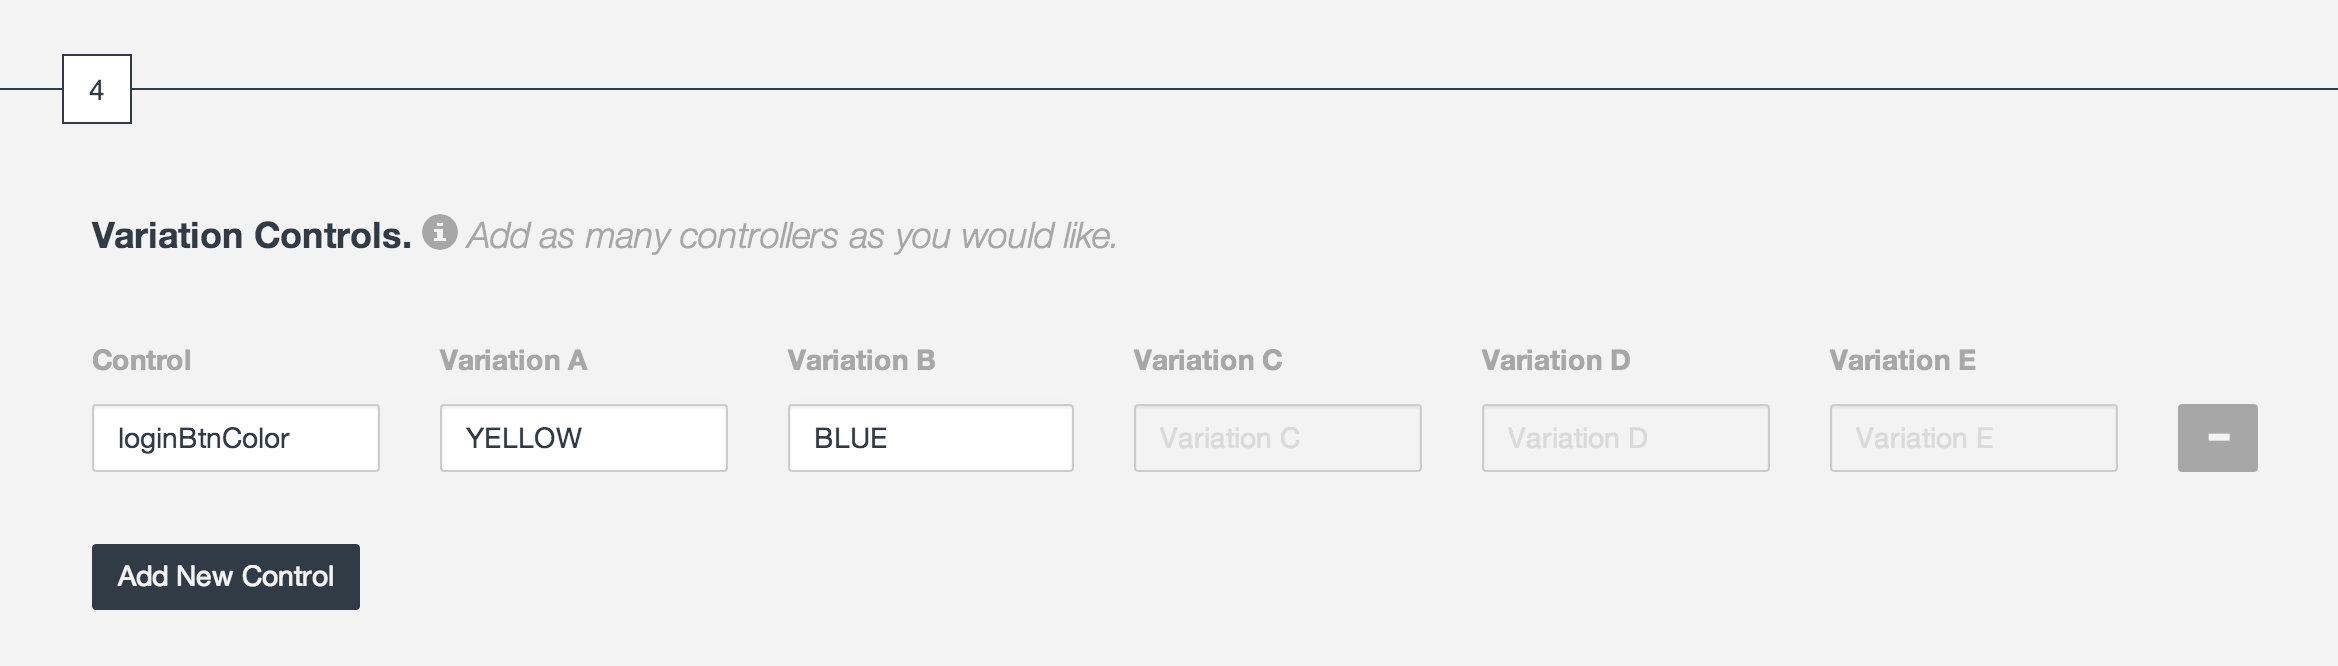
Greg defines controls for each variation as bellow.
Once test is loaded, it remains same for the entire life cycle of particular version for end user irrespective of Internet connection. Following screen demonstrates the end user experience for each variation


Once integration is done, Greg kicks of the experiments by filtering user base by location, device type or average session time etc. and immediately start monitoring the results as follows.
- Vessel Keeps close eye on Trends with Daily Active Installs, Monthly Active Installs
- User Engagement with 1, 3,7,14,30 day retention and session time for each variation as follows
- Vessel also keeps tracks of User Flows. Platform generates user funnel to major success at each checkpoints
- Session time handling for each variation
- Rollout winner: Greg and his team monitored data and found variation B is working better. Hence they can award winning variation to entire user base without pushing any update.

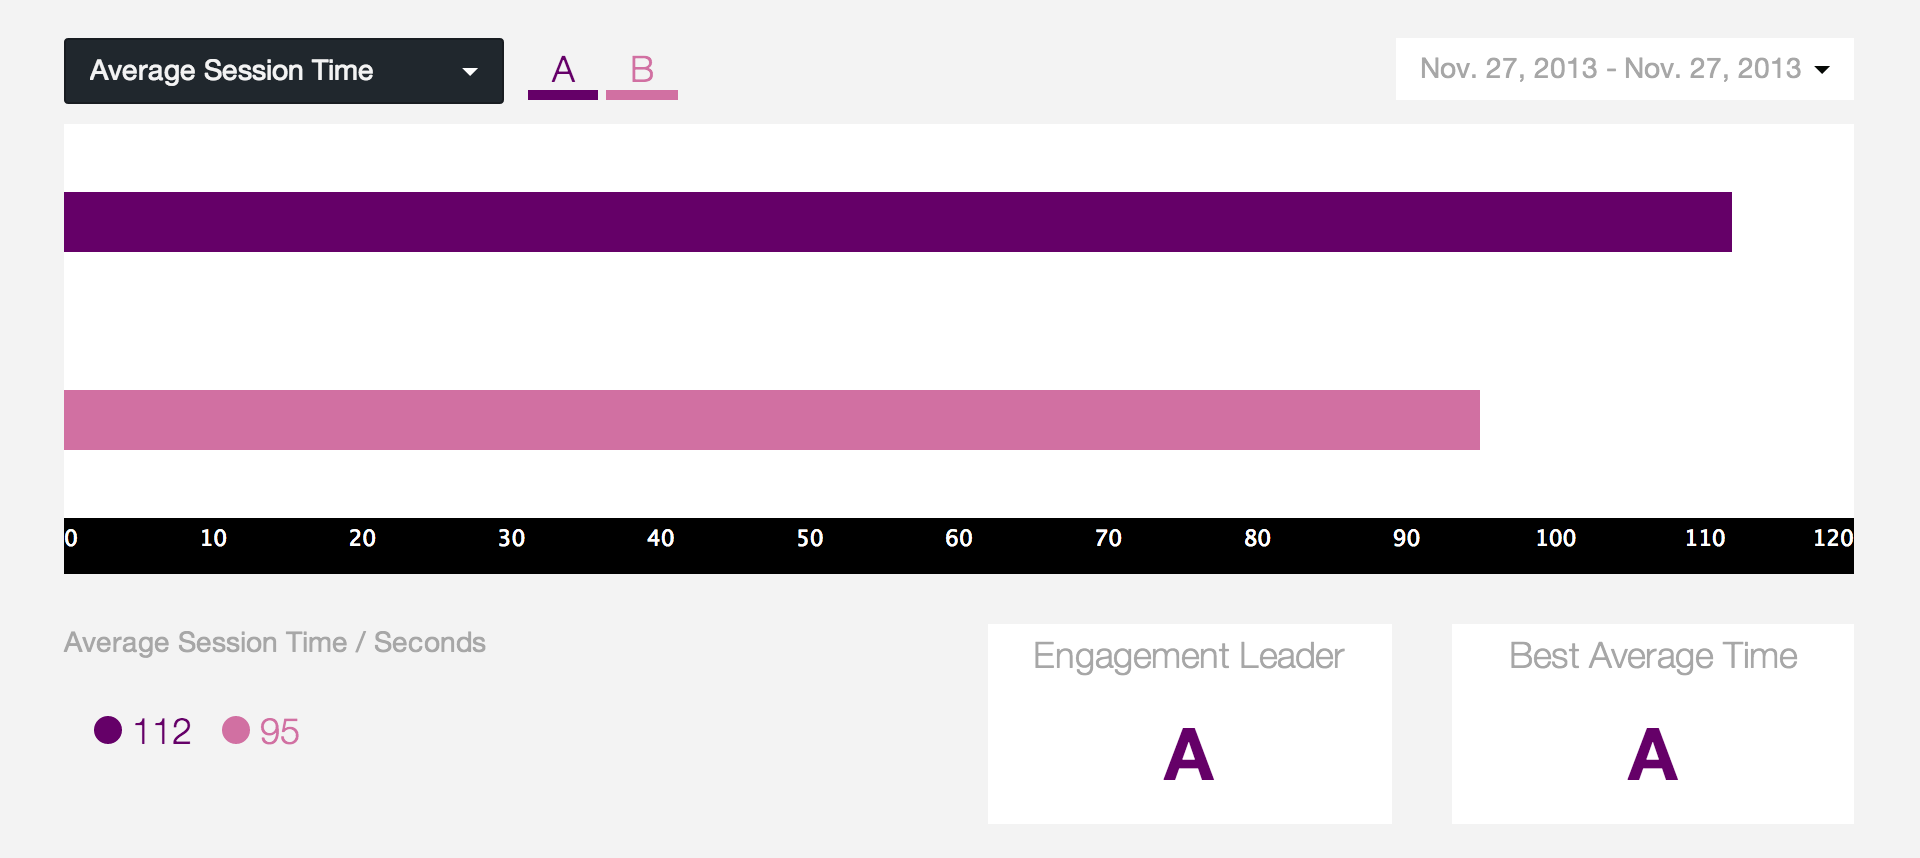

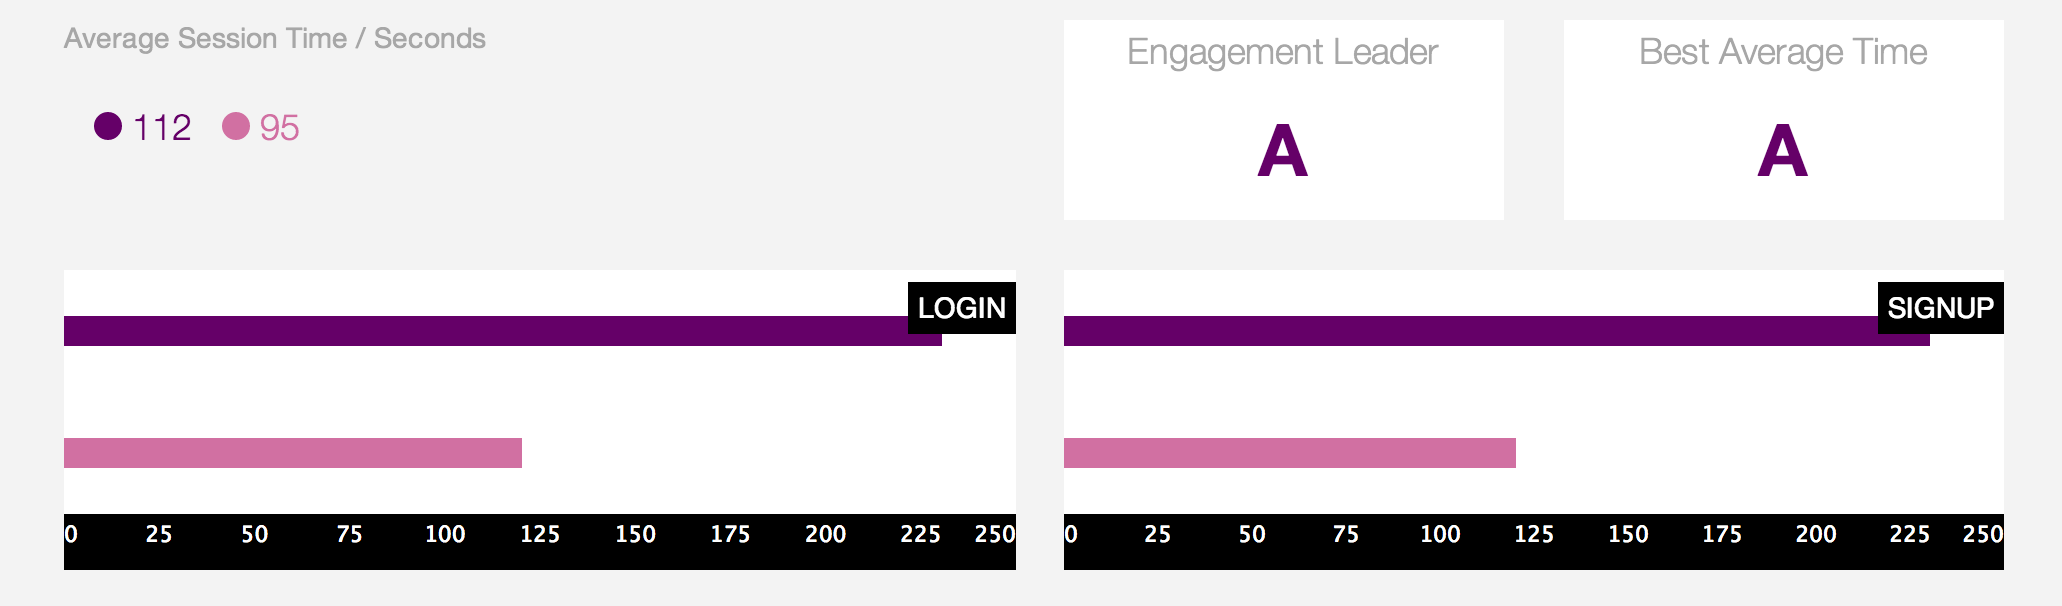
Above results help Greg in not understanding impact of each variation but also demonstrates funnel for each variation. E.g. Session time for variation A is significantly larger than B but users are unable to complete level one while in B average session time is less but 100 % users are able to complete level B.
After gathering more data Vessel Platform will be able to determine confidence level in each variation making it easier for Greg to make final choice for entire user base. Also at any given point of time he has control to tweak experiment without deploying new version.
